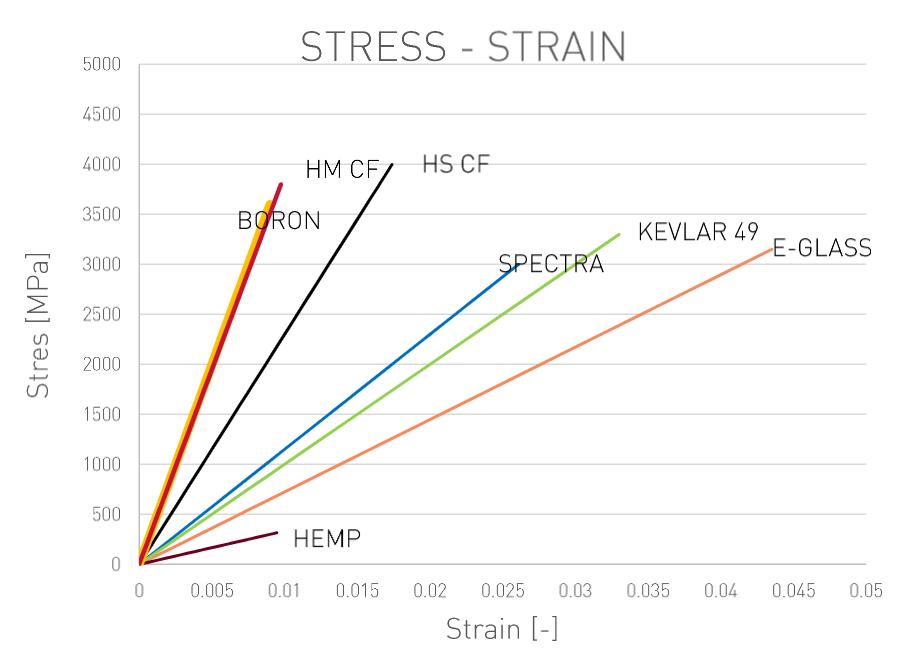
Many different properties of composite materials can be acquired through a stress-strain graph, such as Maximum Tensile Strength, Yield Strength, Young’s Modulus, Resilience, Toughness, etc.
As you can see, each different reinforcement shown in this graph possesses a distinct behavior during testing. Boron and carbon fiber have more inclined curves, and smaller total strain, thus they are more rigid (i.e have higher Young’s Modulus). Materials like Spectra (PE fiber), kevlar (aramid fiber), and fiberglass (E-glass) possess a bigger elastic region, thus a higher total strain before failing.
Understanding these fundamentals and comparing the behavior of different materials is very important for every engineer that works with composites, especially for Materials Engineers. The results for each type of fiber can greatly vary, of course, but graphs like this one paint a good picture of how distinct fibers can fare against each other.